
Readings and Visual Media
2012 East Asia Summit – ASEAN Economies
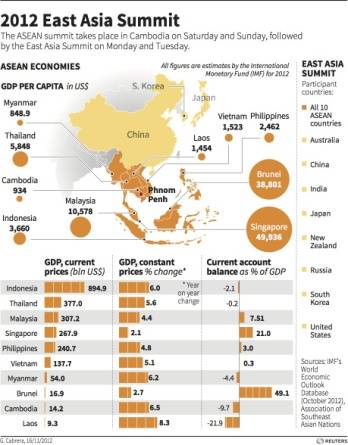
This graphic illustrates the varying levels of development in Southeast Asia. Since climate change is affected by industrialization, it is helpful to see which countries in Southeast Asia might be contributing more to climate change than the others. In addition, since countries at lower levels of development have the most difficulty mitigating the effects of climate change, this graphic also helps illustrate which countries might be most at risk.
http://blog.thomsonreuters.com/index.php/2012-east-asia-summit-graphic-of-the-day/
Jan-Dec Global Mean Temperature Over Land & Ocean
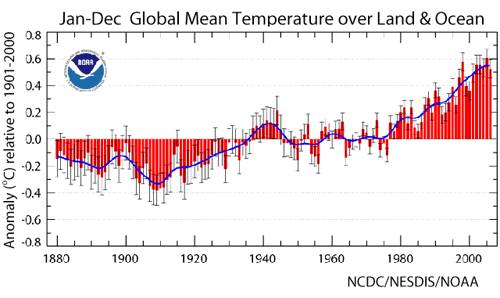
This graphic illustrates how global mean temperatures have changed over the last century.
http://www.wunderground.com/resources/climate/fifth_warmest_year.asp
Ten Signs of a Warming World
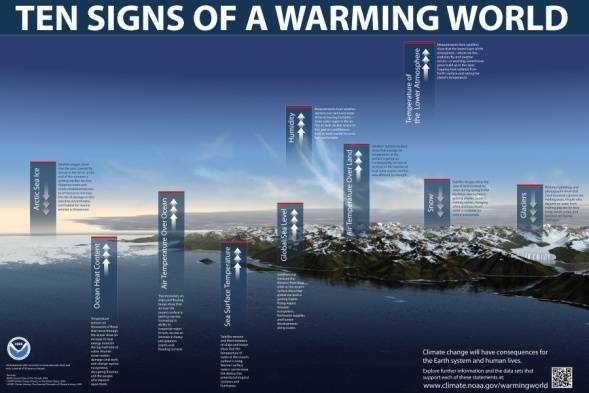
This website produced by NOAA explains the 10 signs that Global Warming is affecting our planet. The site explains each sign in detail and provides a variety of graphs, charts, graphics and videos to support their instruction. In addition, there is a downloadable poster, a downloadable interactive presentation and links to lesson plans appropriate for multiple grade levels over each topic.
Global Surface Temperatures, 2012
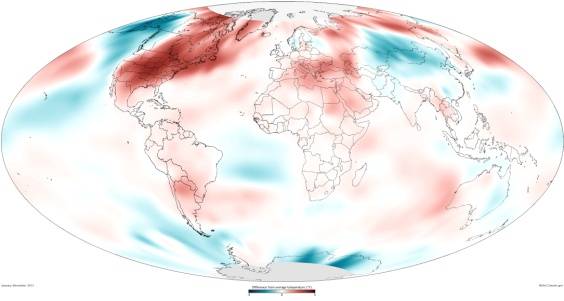
This map shows the difference from average temperatures in 2012. While many areas are much warmer than normal, others are cooler than normal; illustrating that global warming isn’t affecting every place in the same way. Southeast Asia shows slightly higher temperatures than normal.
Global Sea Levels, 2012
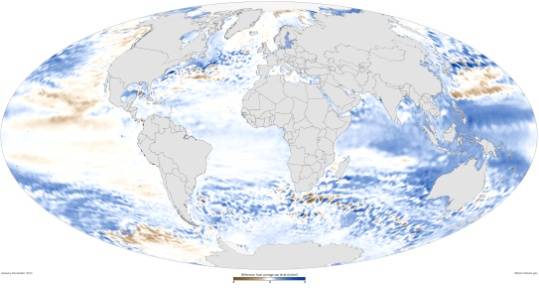
This map shows the difference from average sea levels in 2012. Sea levels near Southeast Asia are clearly rising, while others are falling.
http://www.climate.gov/news-features/understanding-climate/2012-state-climate-global-sea-level
Sea Surface Temperatures, 2012
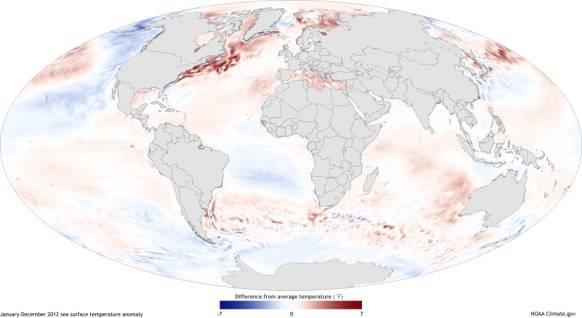
This map illustrates the difference from average sea temperatures in 2012.
Climate Change Vulnerability Index 2011
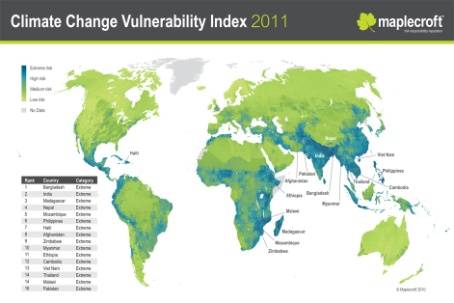
The blue areas in the poster indicate regions that are most environmentally, socially and politically vulnerable to the predicted changes.
http://thescientistgardener.blogspot.com/2010/11/climate-change-and-importance-of.html
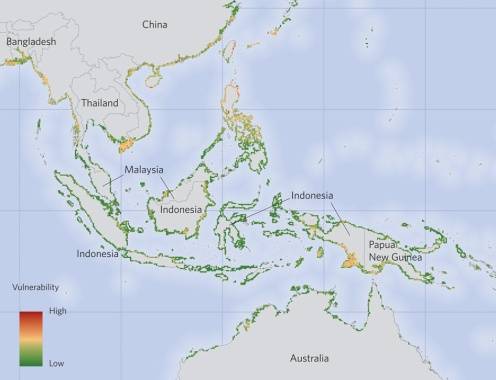
Climate Change: Vulnerability Map of Southeast Asia
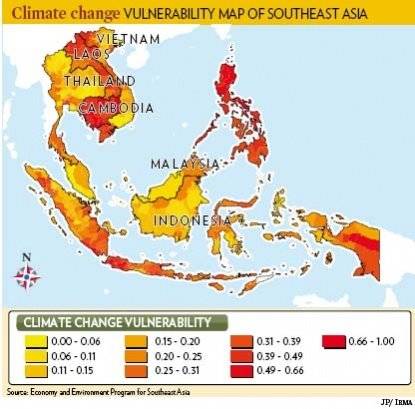
Environment Program for Southeast Asia (EEPSEA), which is administered by the International Development Research Centre of Canada, produced this map showing vulnerability to climate change in Southeast Asia.
http://ki-media.blogspot.com/2009/05/map-pinpoints-se-asian-vulnerability-to.html
Coastal Regions in Southeast Asia Vulnerable to Climate Change
Map depicting coastal regions in Southeast Asia that are particularly vulnerable to climate change produced by Jones, H. et al. 2012.
http://www.nature.com/nclimate/journal/v2/n7/fig_tab/nclimate1463_F1.html
World Bank Infographic
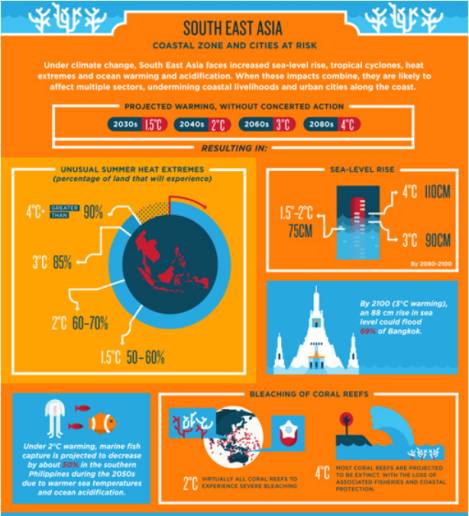
Depicts the effects rising temperatures will have on Southeast Asia.
Climate Demography Vulnerability Index
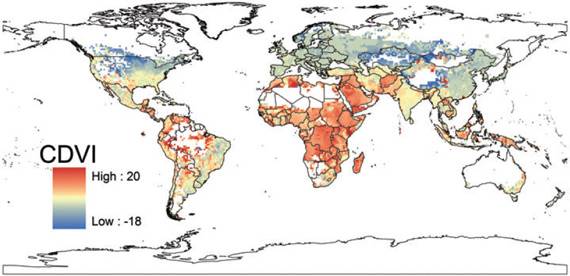
This map illustrates a new way of looking at climate change. The index takes into consideration which world regions will be most impacted by climate change as well as the population growth for those regions in order to illustrate which regions will suffer the most as a result of climate change. Blue areas will be affected the least, while red areas will be affected the most.
National Average CO2 Emissions
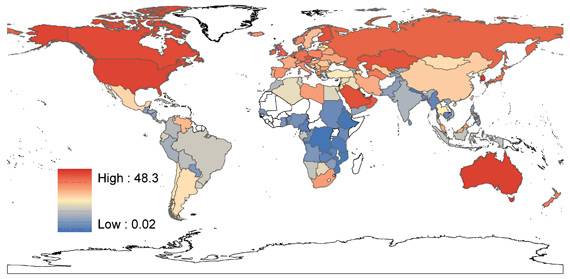
This map is used to compare with the map. The countries which will be affected the least by climate change are the countries which contribute to it the most.
Climatica
Climatica is a climate science and public interaction initiative developed by postgraduate researchers. The site offers short articles about climate change and the Earth system, written by the scientific experts (from postgraduate researchers to professors) for you! The basis of the science, how data is collected and what all of the research is telling us is thoroughly explained. A range of written articles, video talks, blogs from the field, and opportunities for questions and discussion, mean that there is something for everyone.